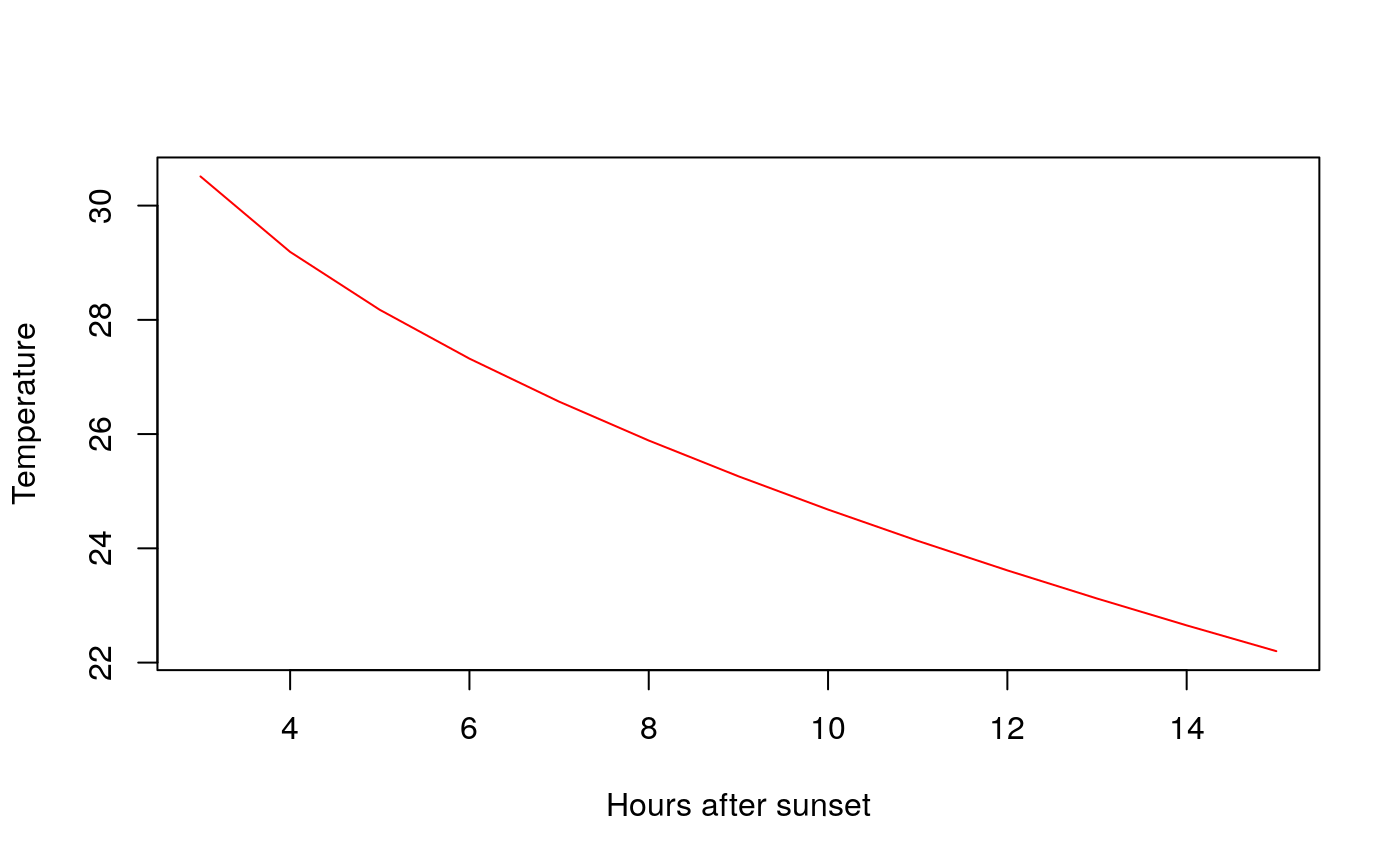
Predict the trend of the temperature during a frost night. This equation has been taken from UC Davis formula [1] which was also published in the FAO book mentioned in predFAO function.
[1] <http://biomet.ucdavis.edu/frostprotection/fp002.htm>
getTrend(Tmin, t2, n, plot = FALSE)
Arguments
| Tmin | predicted minimum temperature. |
|---|---|
| t2 | temperature 2 hours after sunset, where t2 > Tmin |
| n | how many hours between sunset and sunrise, an integer value where n > 2 |
| plot | TRUE if you want to see the trend plot, otherwise FALSE. Default value: FALSE |
Value
A data frame with the (x,y) points plotted, where y values are the n-2 values of estimated temperatures
Examples
getTrend(Tmin = 22.2,t2 = 33.7,n = 15) # in °F degress#>     x        y
#> 1   3 30.51047
#> 2   4 29.18933
#> 3   5 28.17558
#> 4   6 27.32095
#> 5   7 26.56800
#> 6   8 25.88729
#> 7   9 25.26131
#> 8  10 24.67866
#> 9  11 24.13142
#> 10 12 23.61383
#> 11 13 23.12154
#> 12 14 22.65116
#> 13 15 22.20000getTrend(Tmin = -5.45,t2 = 0.95,n = 15,plot=TRUE) # in °C degress#>     x          y
#> 1   3 -0.8250406
#> 2   4 -1.5602865
#> 3   5 -2.1244606
#> 4   6 -2.6000813
#> 5   7 -3.0191115
#> 6   8 -3.3979438
#> 7   9 -3.7463161
#> 8  10 -4.0705731
#> 9  11 -4.3751219
#> 10 12 -4.6631713
#> 11 13 -4.9371438
#> 12 14 -5.1989211
#> 13 15 -5.4500000